How to Read a Photo Histogram
Learn to read your camera's histogram in 5 minutes. Avoid under and overexposed photos. Free, private — photos never leave your device.
That graph on your camera screen isn’t just decoration. It’s actually the most reliable tool you have for checking exposure, and once you understand it, you’ll wonder how you ever shot without it.
Let’s decode the histogram together.
What Is a Histogram in Photography?
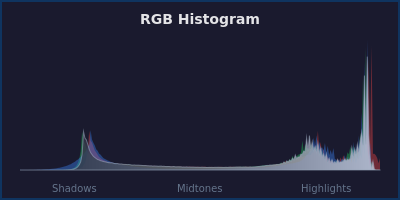
A histogram is a simple bar chart showing the distribution of tones in your photo. Think of it as a map of brightness levels from pure black on the left to pure white on the right.
Every pixel in your image gets counted and plotted on this graph. Dark pixels stack up on the left side, bright pixels on the right, and everything in between fills the middle.
Your camera LCD can lie to you in bright sunlight or dim conditions. The histogram never does. It shows you exactly what data your sensor captured.
Reading the Histogram: Left to Right
The horizontal axis represents brightness levels. The left edge is absolute black (no light), the right edge is absolute white (maximum brightness).
The vertical axis shows how many pixels exist at each brightness level. A tall spike means lots of pixels at that tone. A flat area means few or no pixels at that brightness.
Here’s what different sections represent:
Left side (shadows): The darkest parts of your image live here. Deep shadows, dark clothing, night skies, and anything close to black.
Middle (midtones): Most of your image usually sits here. Skin tones, grass, buildings, and everyday objects occupy this central zone.
Right side (highlights): The brightest areas stack up on the right. Light sources, white surfaces, reflections, and bright skies.
What Does a “Good” Histogram Look Like?
There’s no perfect histogram shape. A snow scene should pile up on the right. A night photo should cluster on the left.
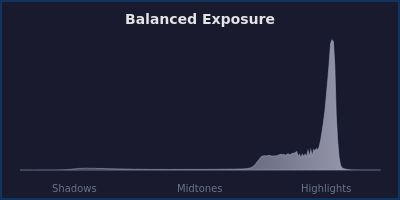
What matters is whether the histogram matches your scene. If you’re photographing a white wall and the graph sits in the middle, something’s wrong. Your camera underexposed.
The key is avoiding unwanted clipping at either end.
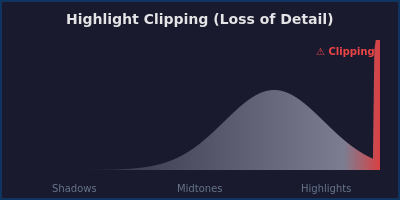
Understanding Clipping: When Detail Disappears
Clipping happens when tones get pushed beyond what your camera can record. Pixels slam against the left or right edge of the histogram, and detail vanishes permanently.
Shadow clipping: When the histogram touches the left edge, you’ve lost detail in the darkest areas. Those regions become pure black with no recoverable information.
Highlight clipping: When the graph hits the right edge, bright areas become pure white blobs. Overexposed clouds, blown-out windows, and featureless bright spots are gone forever.
A little clipping is often acceptable. A tiny spike at the edges might just represent specular highlights or deep shadow areas where detail doesn’t matter.
But if you see large mountains stacked against either edge, you’ve got a problem. That’s significant detail loss that even the best editing tools can’t recover. You may want to check out our guides on fixing dark photos or correcting overexposed images.
How to Use the Histogram When Shooting
Check your histogram immediately after taking a shot, especially in tricky lighting. Don’t trust your screen preview alone.
If you see clipping on the right, reduce your exposure. Lower your ISO, use a faster shutter speed, or stop down your aperture. Retake the shot and check again.
If you see clipping on the left, increase exposure using the opposite adjustments. Your shadows need more light.
When shooting high-contrast scenes, you might not be able to avoid clipping entirely. In those cases, decide what matters most. Preserve highlight detail in a sunset, or keep shadow detail in a portrait.
Some photographers “expose to the right” by pushing the histogram as far right as possible without clipping highlights. This captures maximum sensor data and gives you more flexibility when editing.
Common Histogram Patterns Explained
Bell curve in the middle: A typical scene with balanced tones. Most pixels sit in the midtones with gradual falloff toward shadows and highlights.
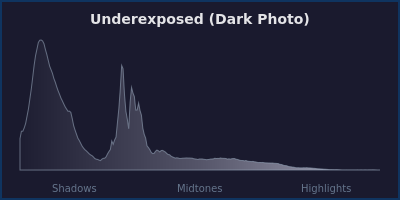
Pushed to the left: A low-key image with predominantly dark tones. Night scenes, dark interiors, or intentionally moody shots look like this.
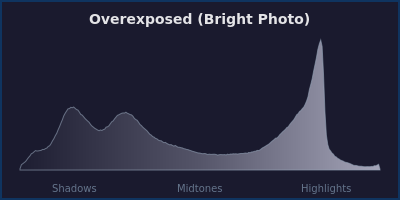
Pushed to the right: A high-key image dominated by bright tones. Snow scenes, white backgrounds, or bright, airy portraits cluster toward the right.
Two peaks: A scene with strong contrast. Bright skies and dark foregrounds create separate mountains on opposite sides with a valley between.
Flat and spread out: An evenly lit scene without strong shadows or highlights. Studio portraits or overcast outdoor shots often show this pattern.
Histogram vs Your Eyes
Your vision adapts constantly to lighting conditions. You can see detail in both the bright window and the dark room corner simultaneously.
Your camera can’t do that. It captures a fixed range of tones in a single frame.
The histogram shows you what your camera actually recorded, not what your eyes see. This is why properly exposed shots sometimes look wrong on your camera screen but perfect when you review them later.
Using Histograms During Photo Editing
Histograms aren’t just for shooting. Every photo editor worth using displays a live histogram as you make adjustments.
When you increase exposure, the entire graph shifts right. Decrease it, and everything moves left. Watch for clipping as you adjust.
Contrast adjustments spread the histogram wider or compress it narrower. Shadows and highlights controls target specific sections of the graph.
PhotoInput shows you a real-time histogram as you edit, updating instantly as you adjust exposure, shadows, highlights, and other controls. You can see exactly how each change affects your tonal distribution.
Practice Makes Perfect
The best way to master histogram reading is to shoot the same scene with different exposures. Take five shots: two stops under, one stop under, correct exposure, one stop over, two stops over.
Compare the histograms and you’ll see how exposure changes shift the graph left and right. Notice how clipping appears at the extremes.
Do this exercise a few times and histogram reading becomes second nature. You’ll glance at that little graph and instantly know if your exposure is dialed in.
Frequently Asked Questions
What does a histogram show in photography?
A histogram displays the distribution of brightness levels in your photo as a graph. The left side shows dark tones, the right side shows bright tones, and the height indicates how many pixels exist at each brightness level.
How do I know if my histogram is good?
A good histogram matches your scene. There’s no universal “correct” shape. Check that the graph fits within the frame without large spikes against the edges (clipping), and verify it aligns with what you’re photographing.
What does it mean when the histogram touches the edge?
When the histogram touches or climbs the left edge, you’ve lost shadow detail to pure black. When it touches the right edge, you’ve lost highlight detail to pure white. This is called clipping and represents unrecoverable information.
Should my histogram be in the middle?
Not necessarily. The histogram should reflect your scene. Dark scenes naturally cluster left, bright scenes cluster right. Middle-positioned histograms work for average scenes, but forcing every shot into the middle will create incorrect exposures.
Can you fix a bad histogram in editing?
You can shift tones and adjust distribution, but you cannot recover clipped detail. If your histogram showed clipping when you shot the photo, those pure black or pure white areas contain no data to edit. Proper exposure while shooting is essential.
What is the difference between RGB and luminosity histograms?
A luminosity histogram shows overall brightness across all color channels combined. An RGB histogram displays separate graphs for red, green, and blue channels, helping you spot color clipping or color cast issues that might not appear in the luminosity view.
Try it on your own photo
Drop a photo, see your score, fix everything in one click.
Fix Your Photo Now